Market Timing
Market Timing Indicator - Overview
Market Timing - Pattern Analysis
Market Timing - Projection View
Market Timing - Multi-timeframe
Overview
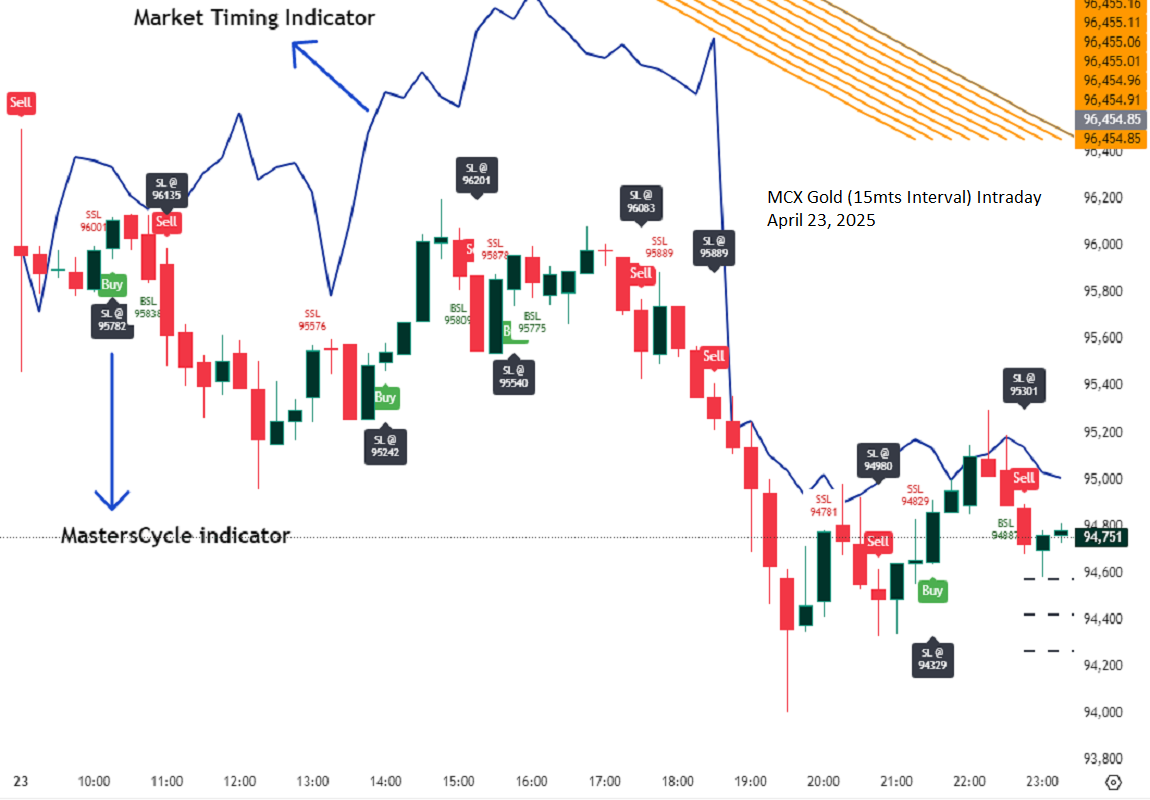
Market Timing is a proprietary visualization tool that helps traders study historical market behaviour through structural pattern similarity.
It analyzes the most recent session’s price action and finds the closest-matching historical sequence from thousands of past patterns. Once a match is identified, it projects the subsequent historical price path onto the current chart for easy visual comparison.
Unlike traditional indicators, Market Timing does not generate trade signals. Instead, it provides a quantified historical scenario view based on structural similarity.
Key Features
Historical Pattern Matching
- Quantitative comparison to find the most similar past price structure.
Dynamic Projections
- Visualizes likely market scenarios based on historical continuation.
Auto / Manual Projection Length
- Adjustable number of projected bars.
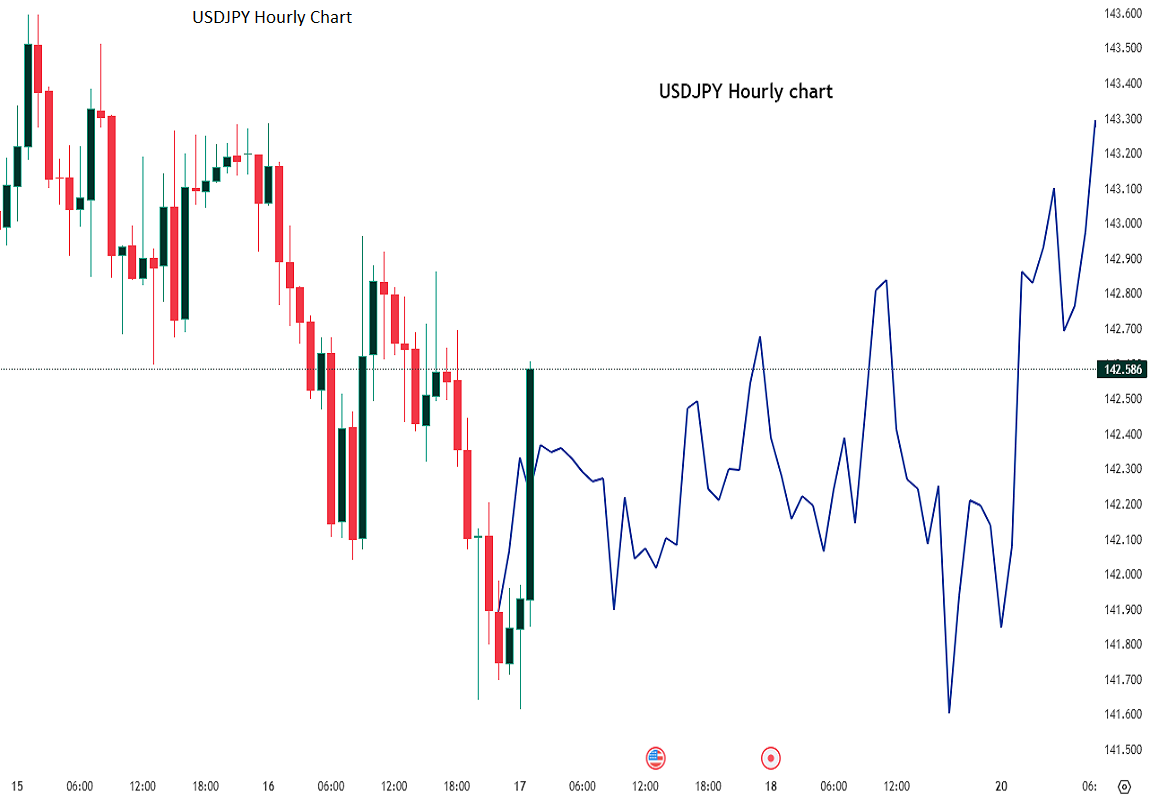
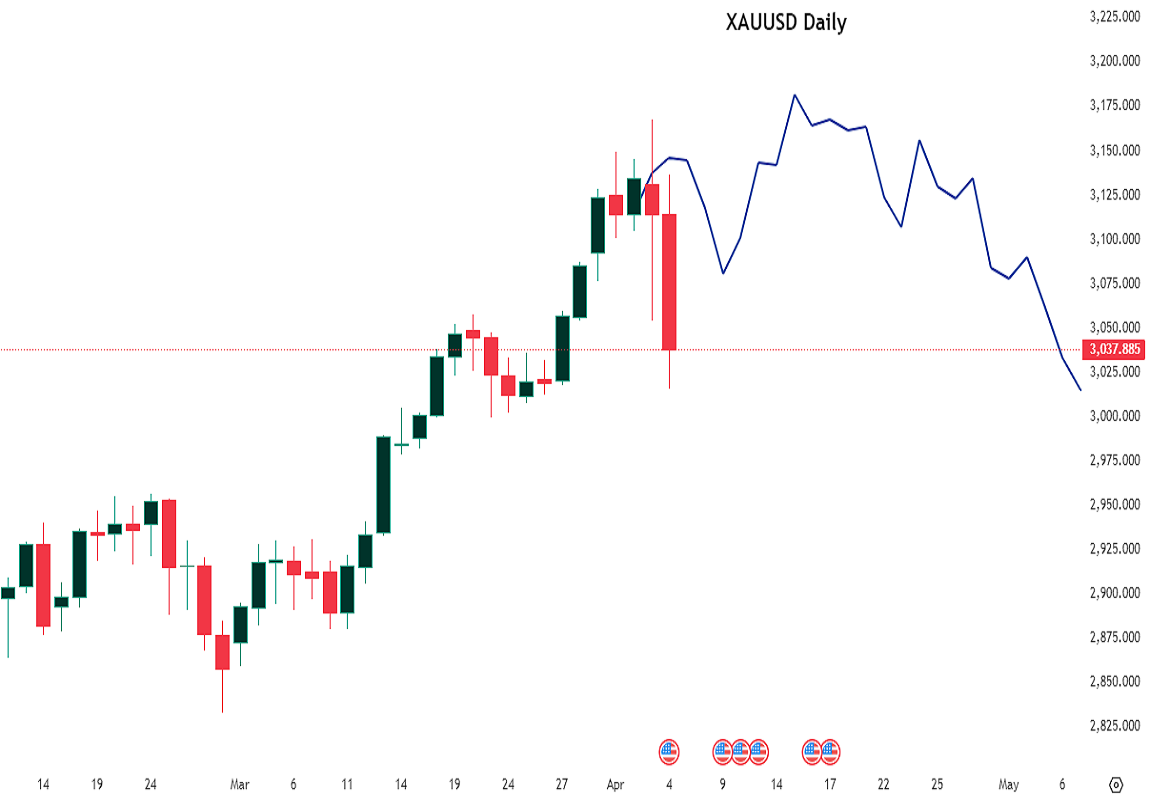
Multi-Timeframe Support
- Works efficiently across intraday, daily, weekly, and monthly charts.
Purely Visual Decision Support
- Enhances trader insight without generating automatic trade signals.
How It Works
- Captures the last 20 closing prices.
- Compares them to past price sequences from the previous 8000 bars.
- Uses Euclidean distance (sum of squared differences) to score similarity.
- Once the closest match is found:
- The subsequent historical path is normalized relative to the session open.
- Projection lines are plotted onto the current chart.
- Projection adjusts automatically to:
- Intraday
- Daily
- Weekly
- Monthly
- Session start is auto-detected using price-time behavior and volume thresholds.
Who May Benefit
- Traders studying price symmetry and market structure repetition
- Visual planners who prefer scenario-based analysis
- Intraday, swing, and positional traders seeking historical context to complement:
- Price action
- Volume
- Momentum indicators
How to Use
- Apply the script to any asset:
- Indices, stocks, commodities, forex, crypto
- Select your preferred timeframe.
- Choose Auto or Custom projection length.
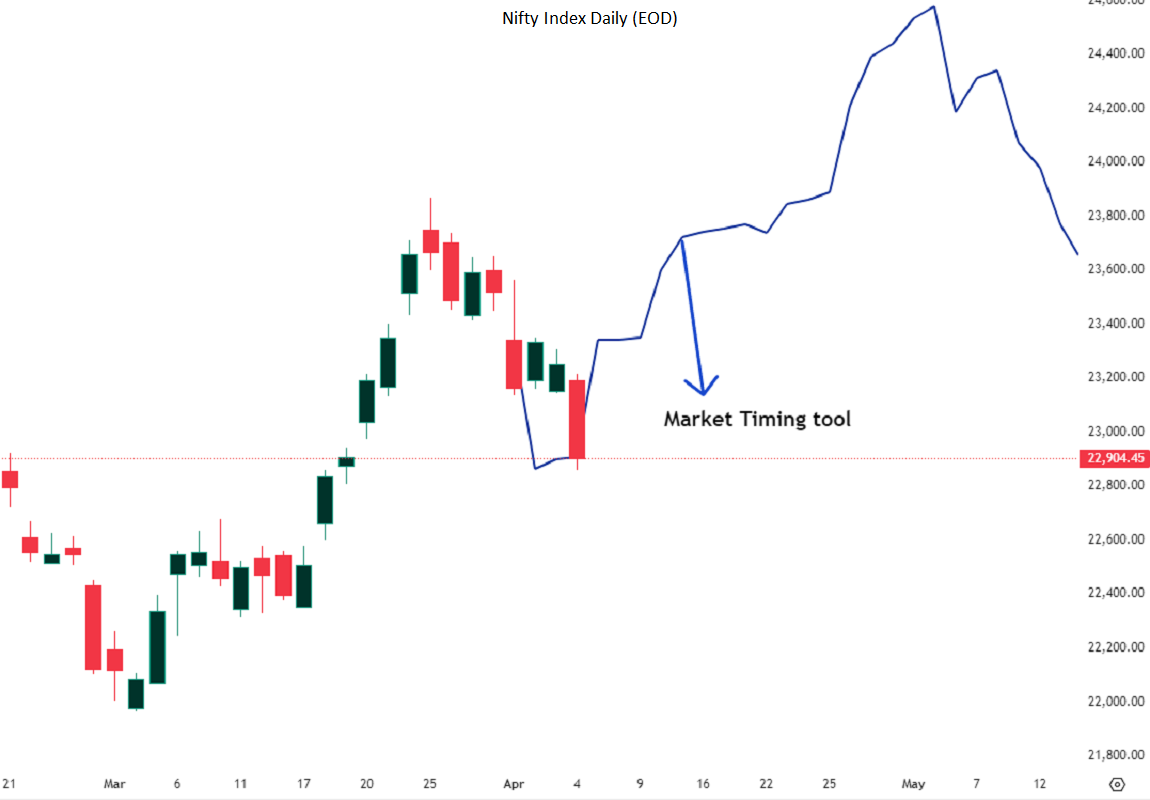
- Read projections visually:
- Upward slope → historically bullish continuation
- Downward slope → historically bearish continuation
- Flat movement → historically sideways context
- Combine with:
- Volume analysis
- Support & resistance
- Price action
For best results, pair with momentum or price structure tools.
Important Notes
- This tool does not predict the future
- Use projections as visual references, not signals
- Market structure evolves; history may not repeat
- Always confirm with live market data
- Intended for education and research
Disclaimer
This is not financial advice. The Market Timing tool is for educational and research purposes only. Trading carries risk, and past performance does not guarantee future outcomes. Always apply proper risk management.
TradingView Link
To view the indicator in TradingView: Click here