The Advance Forecast Charts are the core of this site’s work: cycle-based maps of probable turning windows, built for technical analysts, market students, and traders who want to study how market cycles have played out over historical data.
Each chart reads the likelihood of market movement from past price cycles. Two things are deliberate about them: they carry no price scale, and they are not meant to be used as standalone trading signals. They are a study aid, a way to think about when a trend may be running out of room, which you then combine with your own analysis.
Forecast Chart Categories
1. Intraday Forecast Charts
- Prepared one month in advance.
- 5-minute interval for 6-hour trading sessions, and 15-, 30-, or 60-minute intervals for 12+ hour trading sessions - or customizable time intervals tailored to the trader’s specific needs.
- Published at the end of every month for the following month.
- Purpose: Identify probable intraday trend directions for educational reference

01 sensex intraday forecast

02 sensex intraday comparison

03 nifty intraday forecast

04 nifty intraday comparision
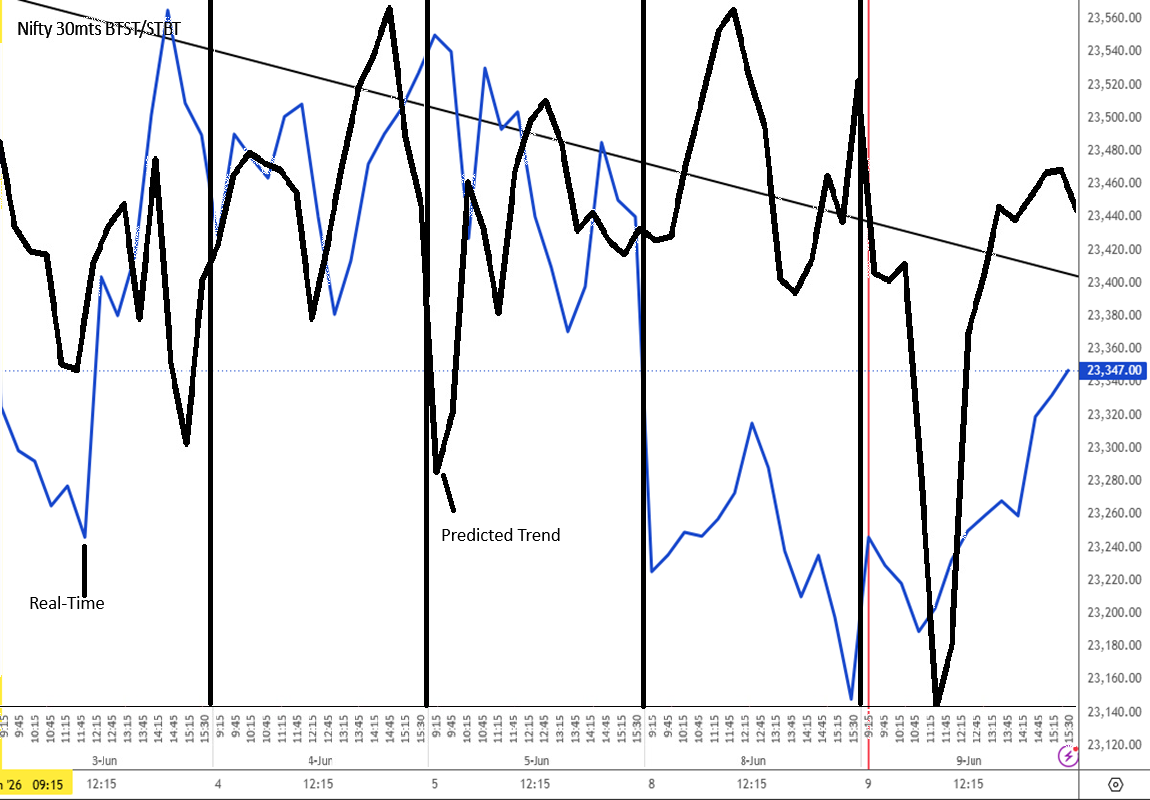
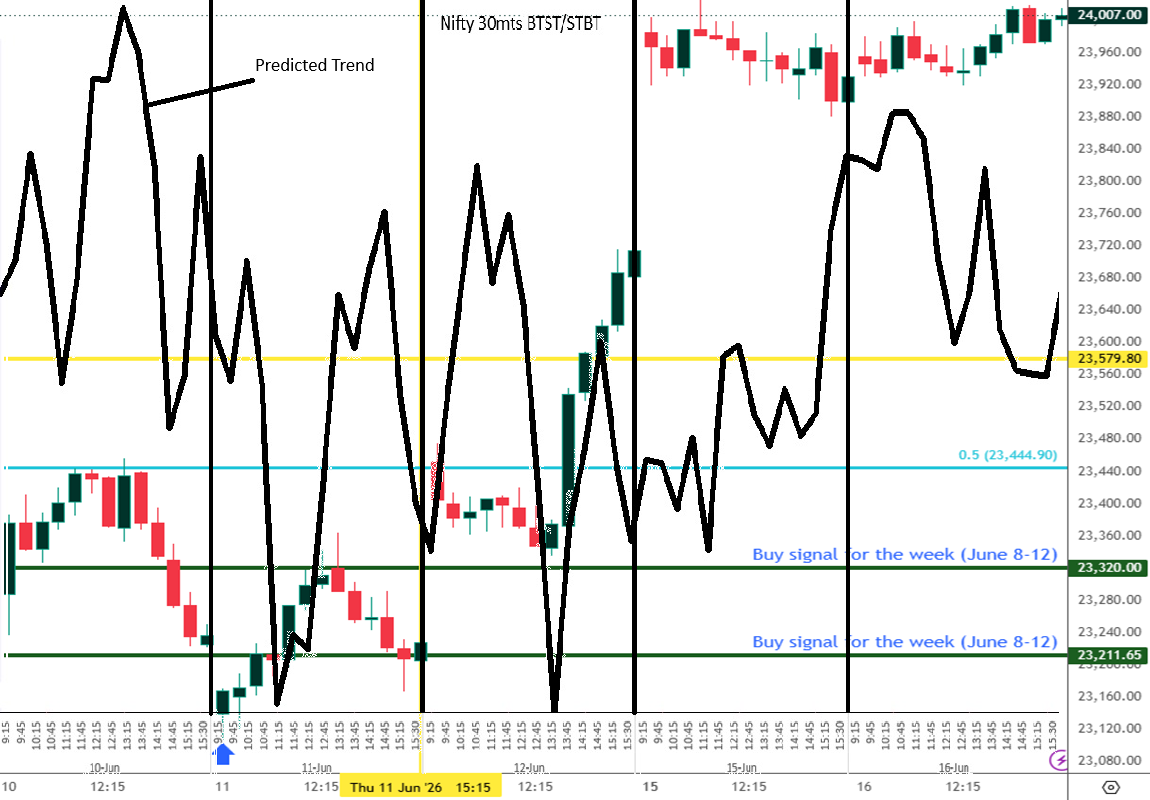
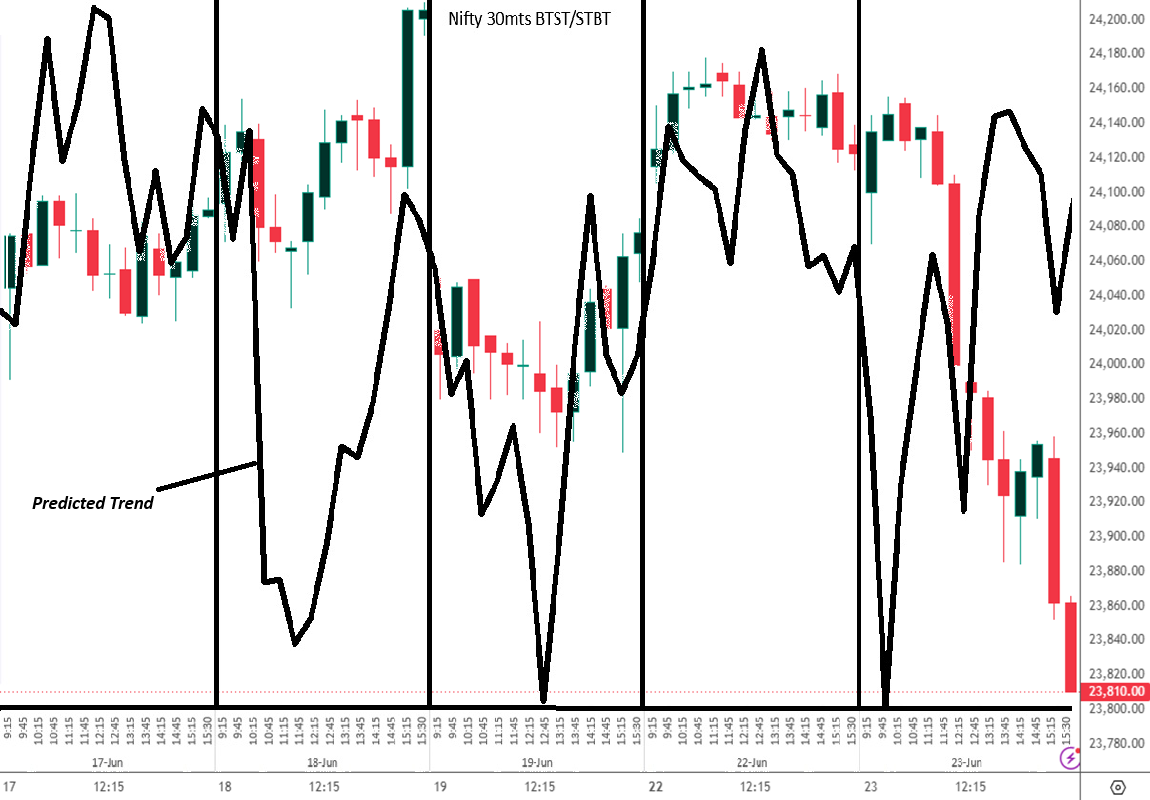
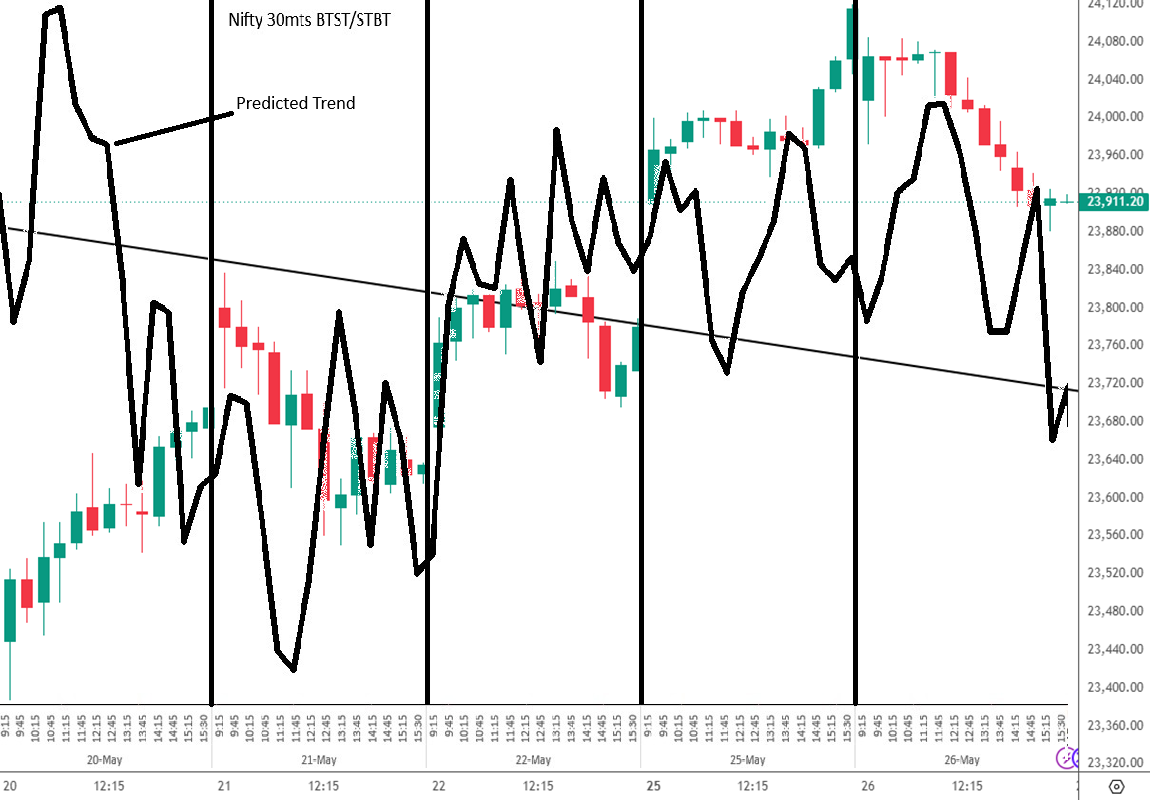
2. BTST/STBT Forecast Charts (Buy Today Sell Tomorrow / Sell Today Buy Tomorrow)
- Prepared once every 3 months in advance.
- Available in 30-minute intervals (6 hours trading) or 60m/120m intervals (24 hours trading).
- Includes date-wise demarcation for 5 trading sessions.
- Purpose: To study weekly swing cycles for a better understanding of short-term patterns.

01 nifty btst forecast chart

02 nifty btst forecast chart

02nbtst

05nbtst

07nbtst
09nbtst

10n30m

12nbtst

13nbtst
16nbtst

19nbtst

21nbtst
23nbtst

24nbtst
26nbtst

28nbtst

30nbtst
3. Daily (End of Day) Forecast Charts
- Prepared at the end of every month for the upcoming calendar month.
- Highlights likely trends with key turning dates.
- Purpose: Understand the broader market trend for a month and identify potential turning points.

00 heromotors daily intrepretation
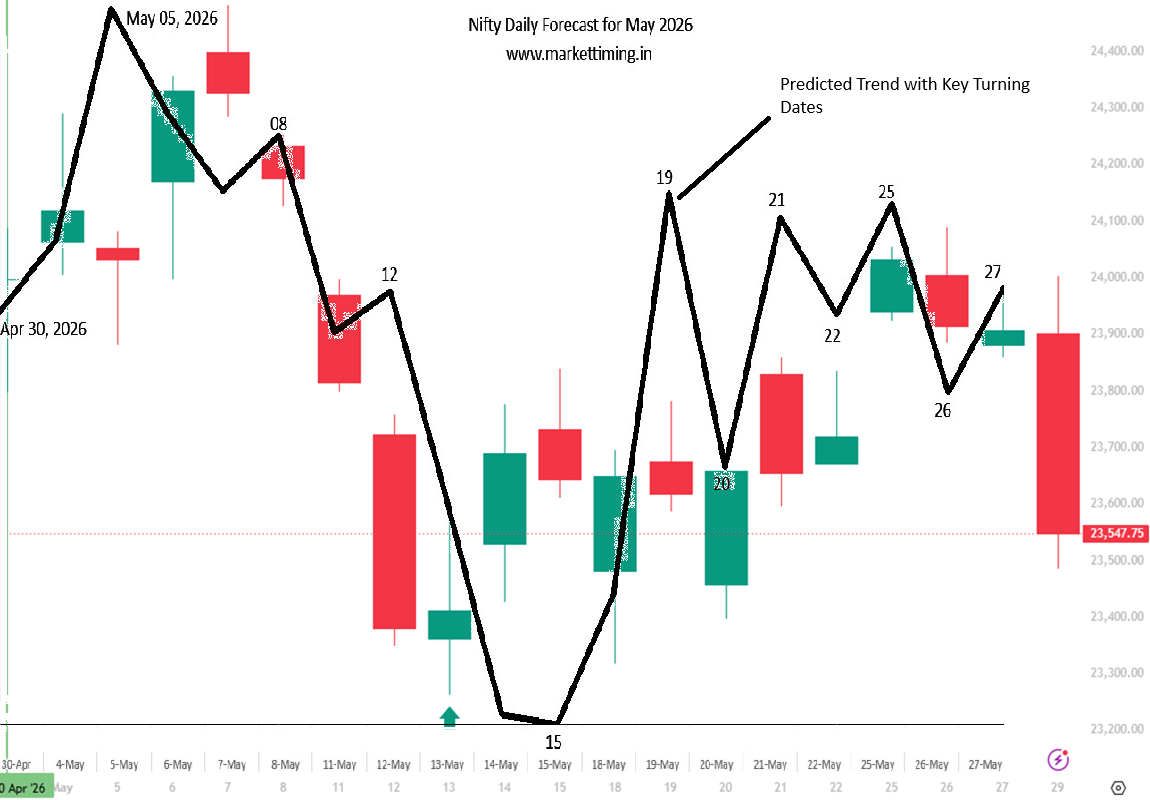
001 n eod

01 heromotors daily forecast

02 heromotors daily forecast

03 nifty daily forecast chart

19 decjannfty
4. Yearly Forecast Charts
- Prepared every December for the following year.
- Weekly interval with key turning points marked.
- Purpose: Gain perspective on larger market cycles useful for long-term educational study.

01 2020 nifty yearly

02 2020 gold yearly
What Makes These Charts Different
They are built from the maximum available historical data for each instrument, and they work across intraday, swing, positional and investment timeframes. The focus throughout is timing and trend awareness rather than price prediction, so they suit anyone who wants to practise cycle-based study rather than chase signals.
Important Disclaimer
These charts do not provide price targets or buy/sell recommendations, and they are prepared only when there is enough historical data to work with. They are a study aid meant to support your own analysis, not a substitute for independent research or professional financial advice. The market can move against any cycle reading, so always do your own work and manage risk.