Advanced Swing Trading Suite
02advancedswing
03swinglevels
1 advance swing trading suite
2 advance swing trading suite
3 advance swing trading suite
4 advance swing trading suite

Ast
Swingtrade
Description
The Advanced Swing Trading Suite is an all-in-one trading assistant designed for active swing traders. It combines momentum-based entry detection, swing structure mapping, dynamic P&L tracking, and lot size calculations into one compact tool. Its goal is to simplify decision-making by:
- Automatically marking trade signals
- Projecting potential levels
- Maintaining detailed trade statistics directly on the chart
Uniqueness
This suite stands out by integrating multiple professional-grade features into one script. Instead of switching between separate tools for:
- Signals
- Risk management
- Swing analysis
- Lot sizing
Traders get a self-contained environment that:
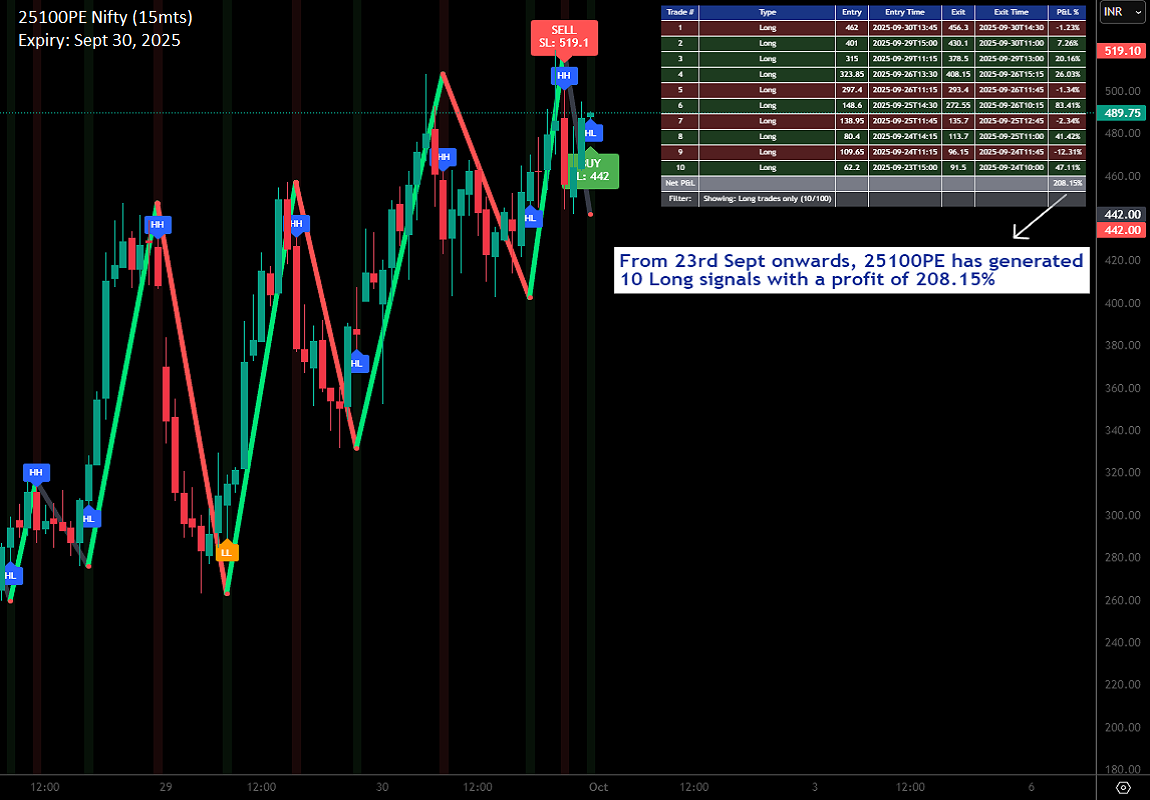
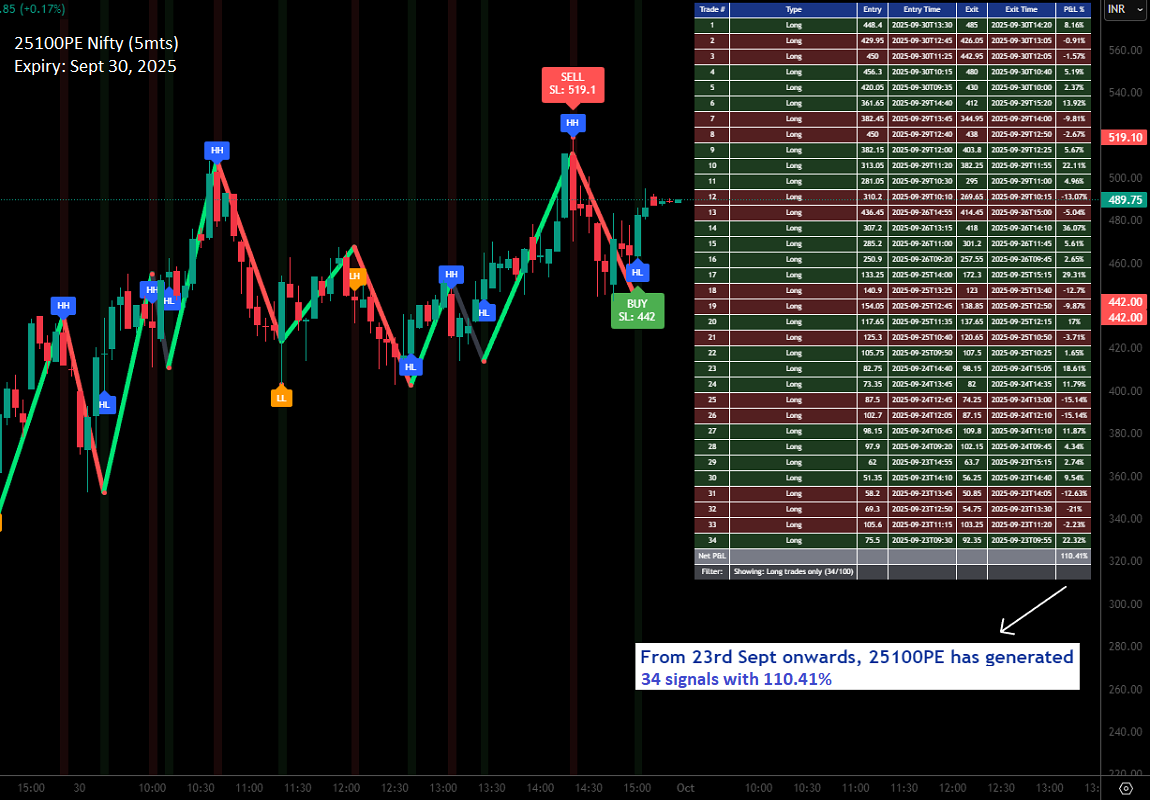
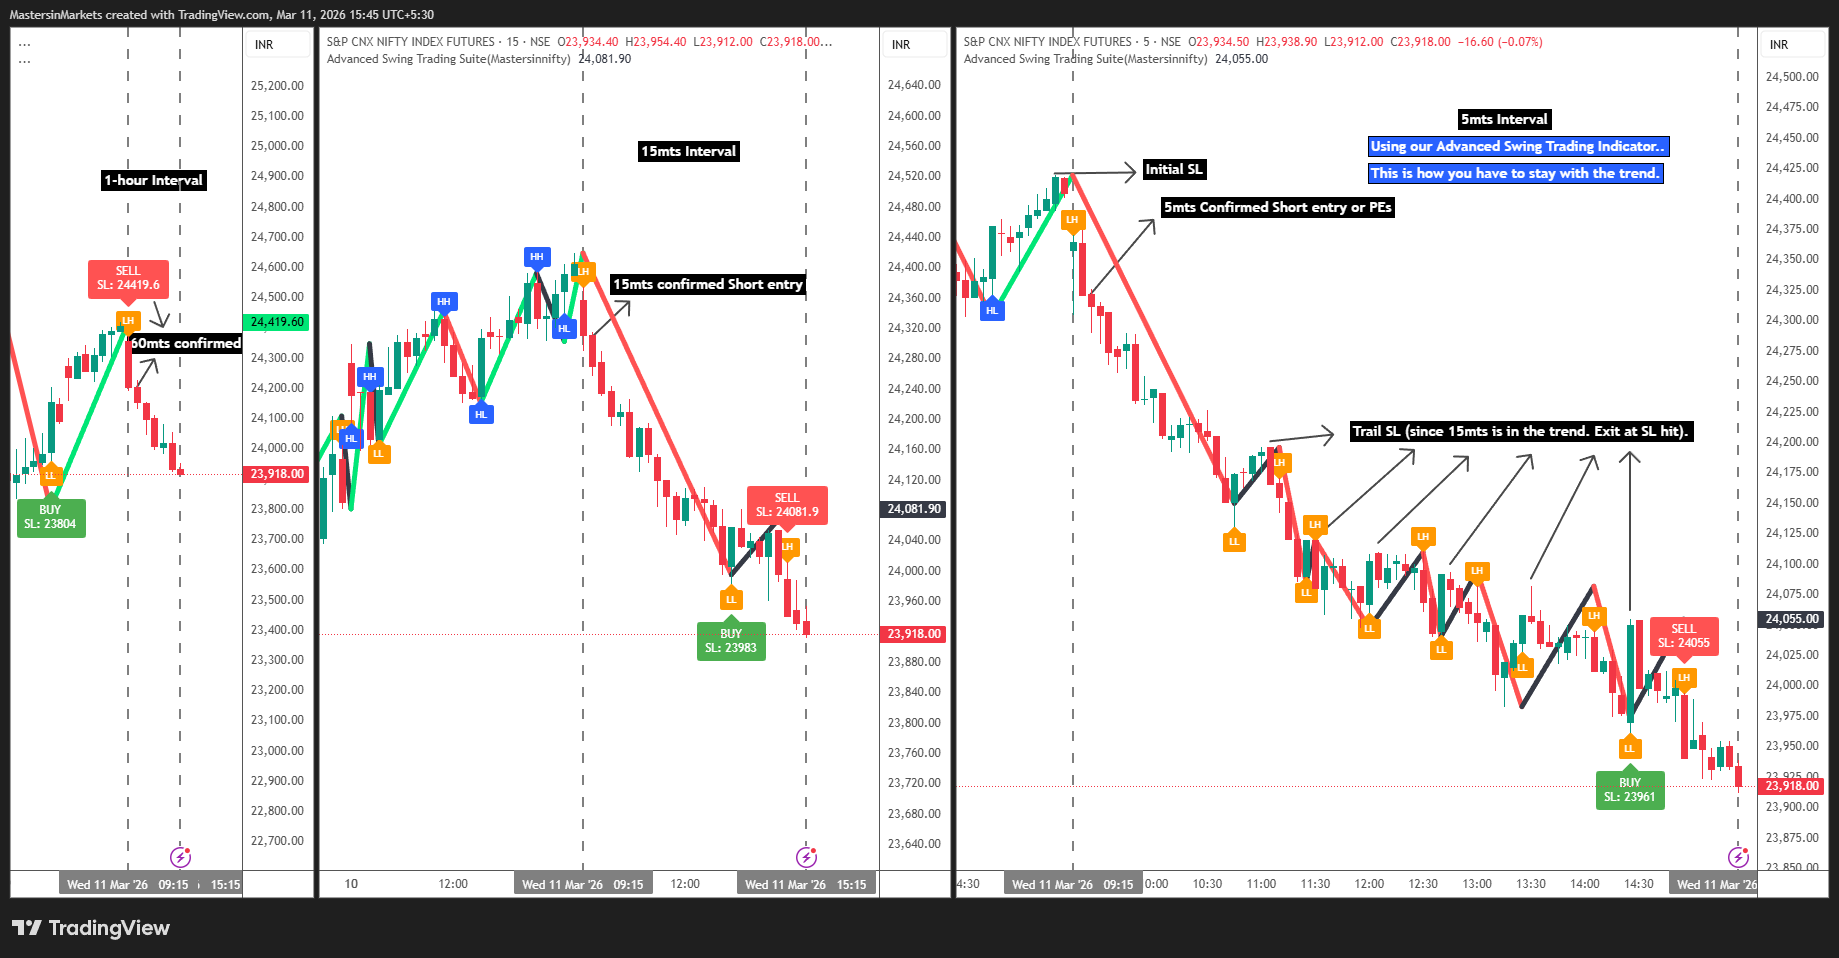
- Automatically marks structural swings (HH, HL, LH, LL)
- Maintains a running trade history with percentage P&L
- Places live stop-losses from swing levels
- Displays projected levels and risk-adjusted lot sizing
This makes it more than just a signal generator—it becomes a complete swing trading workflow manager.
Key Features
Swing Structure Identification
- Labels: Higher Highs (HH), Higher Lows (HL), Lower Highs (LH), Lower Lows (LL)
- Visually maps market phases for better trend recognition
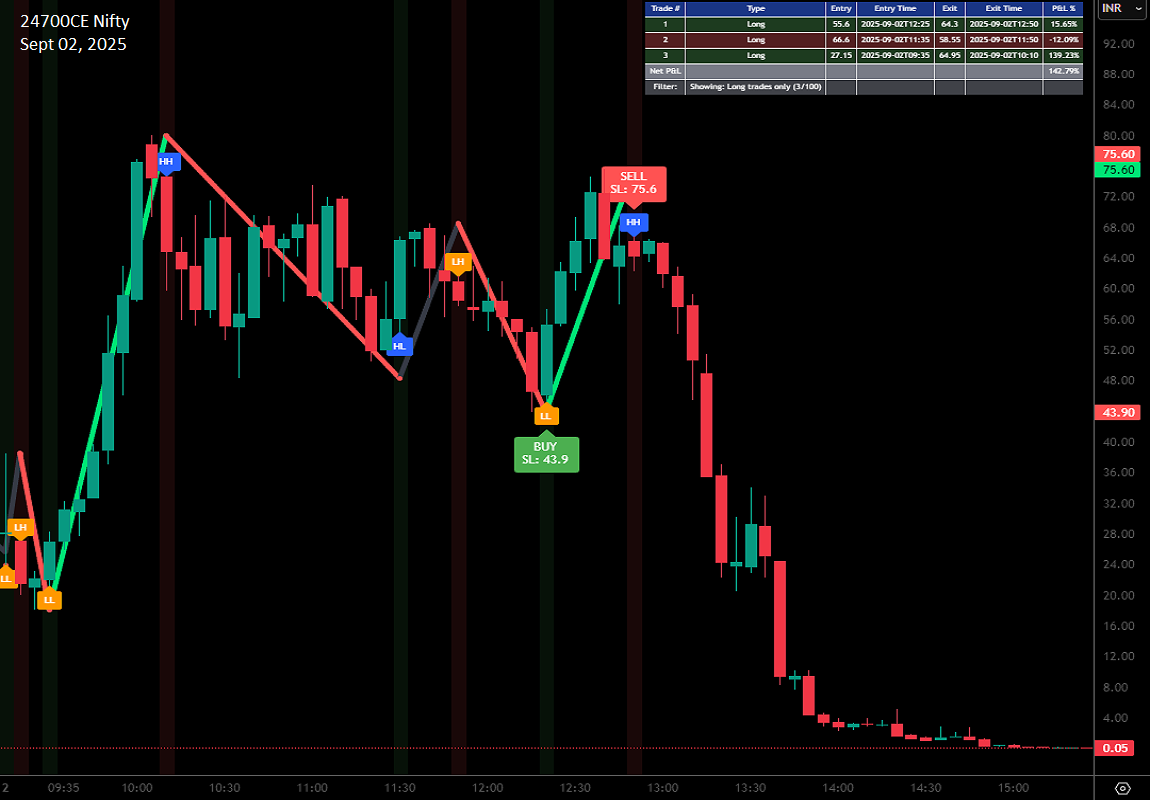
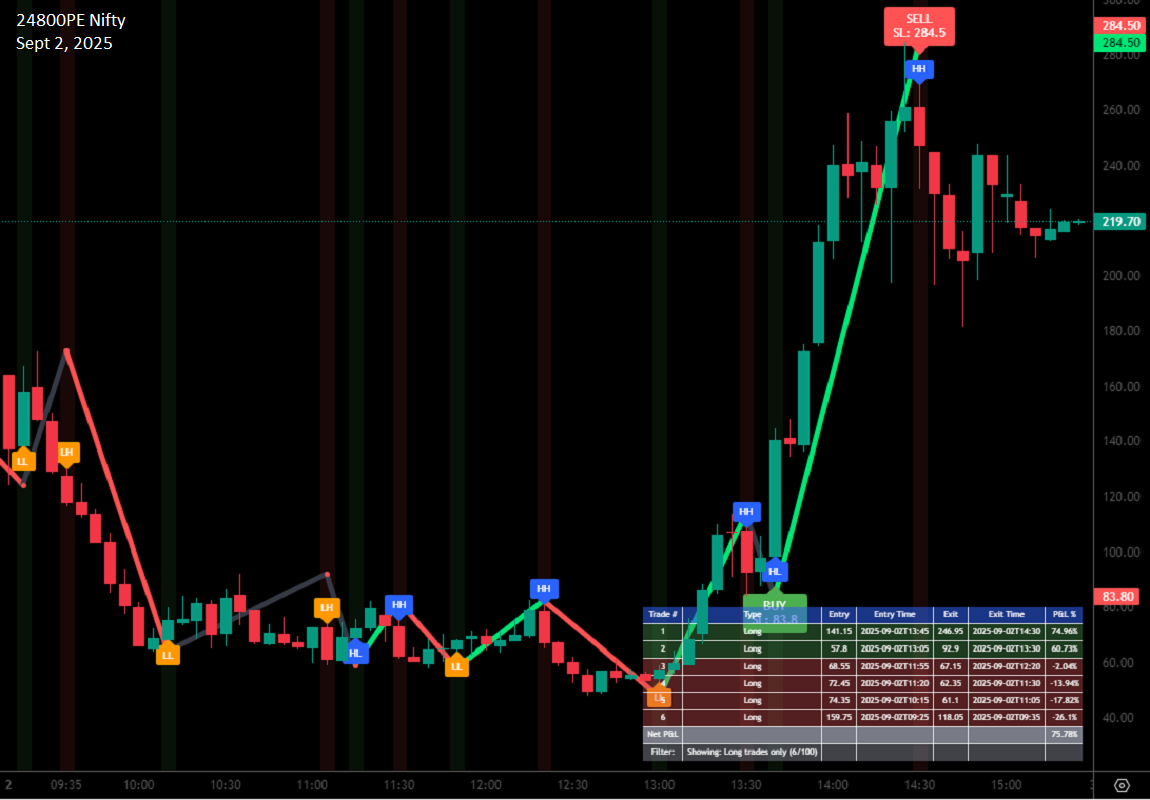
Dynamic Trade Table
- Tracks entry, exit, time, and profit/loss percentages
- Filters trades (Long / Short / Both) with adjustable history depth
- Displays net P&L summary for recent trades
Stop-Loss & Signal Markers
- Automatically places stop-loss levels at recent swing points
- Clear buy/sell markers with corresponding SL values
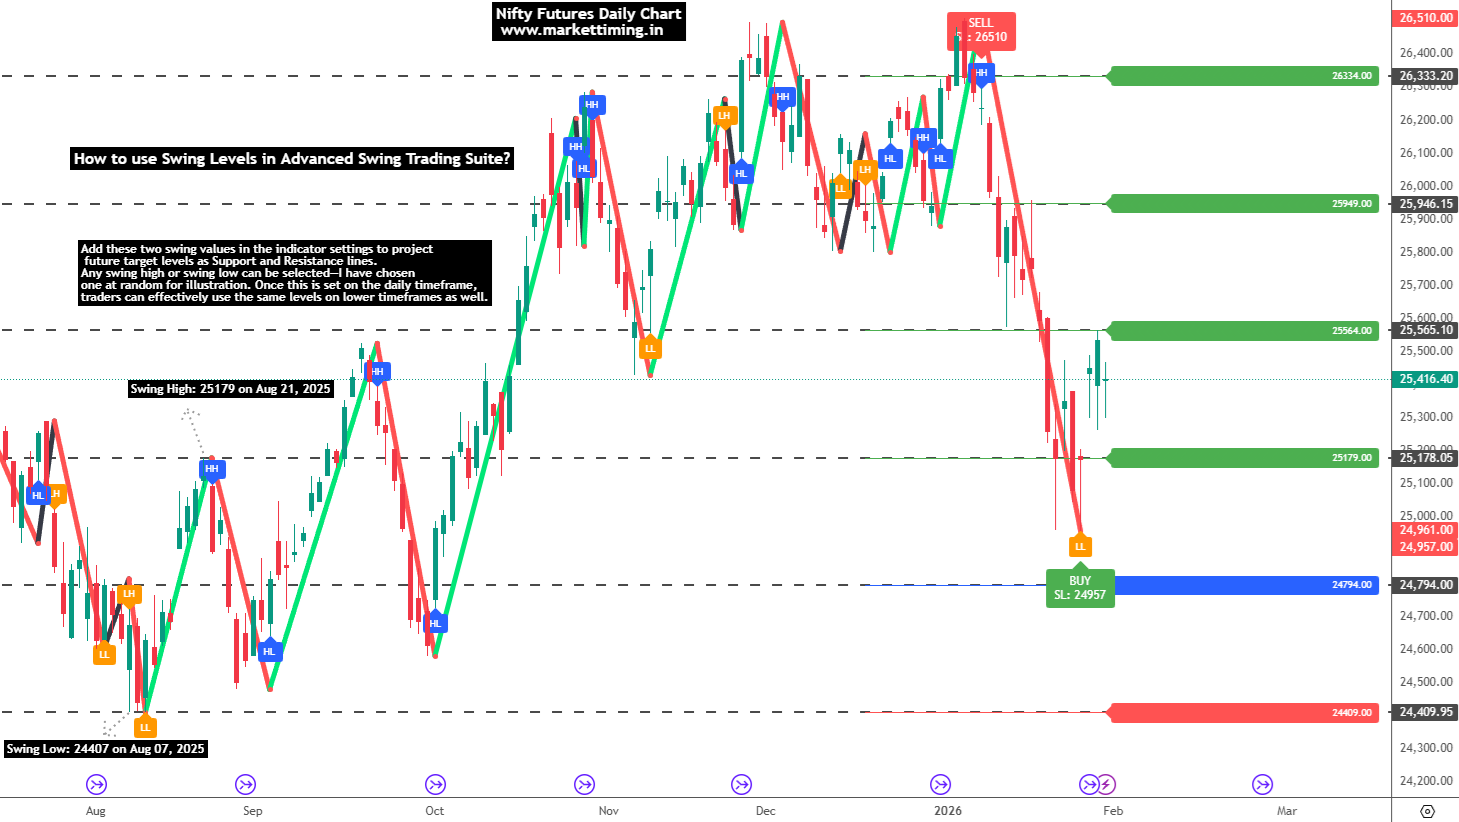
Swing Levels & Extensions
- User-defined swing high/low projections
- Multiple extension levels with color-coded target lines
Integrated Lot Size Calculator
- Dynamically calculates position size based on account value and entry price
- Displays results in a floating table (lots, shares, price, amount)
Visual Enhancements
- Zigzag swing path plotting
- Background highlights for trade signals
- Customizable label sizes, colors, and table positions
How to Use
1. Add to Chart
Apply the script to any instrument and timeframe suitable for swing trading.
2. Interpret Signals
- Green background + “BUY” labels → long opportunity
- Red background + “SELL” labels → short opportunity
- Stop-loss is shown as small red circles
3. Check Swing Structure
- Look for HH/HL in uptrends
- Look for LH/LL in downtrends
- Align trades with the market structure
4. Review Trade Table
- Open the swing percentage table to analyze past performance
- Filter trades (Long / Short / Both)
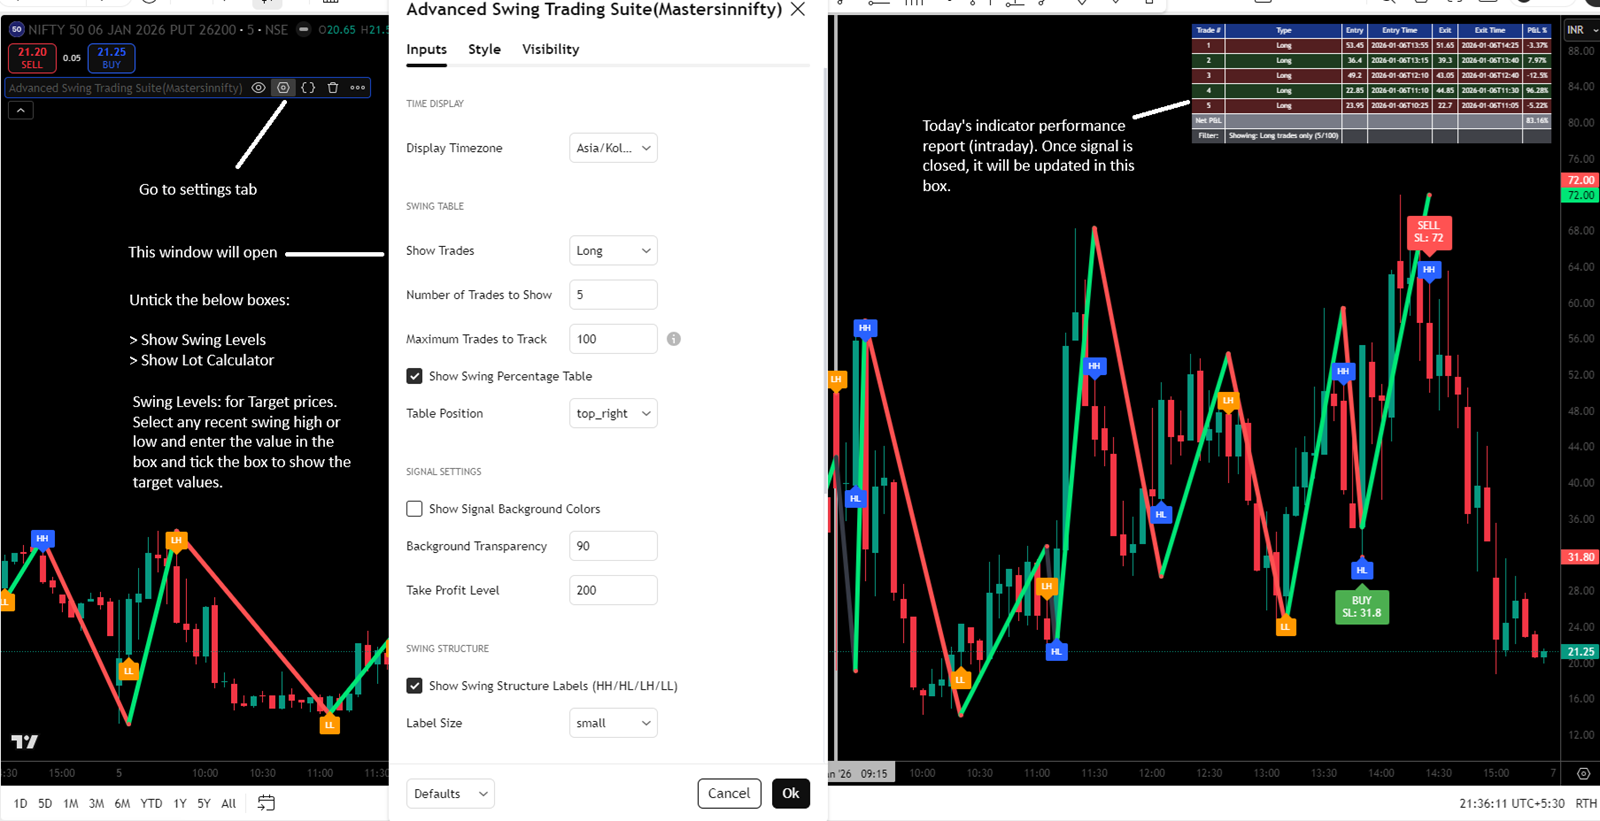
5. Use Swing Levels
- Activate projected levels to plan entries, exits, or partial targets
6. Lot Size Management
- Input your capital and lot size preferences
- Use the calculator to determine exact size (lots/shares)
Disclaimer
This is a technical analysis tool for educational purposes only.
It is not financial advice. Always backtest thoroughly and apply proper risk management before using in live trading.
TradingView Link
To view the indicator in TradingView: Click Here